How to Debug Real-World Projects Using JavaScript in 2025
Debugging is an essential and often challenging aspect of any programmer’s work, and when it comes to web applications, it can be especially difficult and time-consuming. With JavaScript firmly established as the language of the Web and the core scripting technology for web browsers, debugging JavaScript has become an art form that every developer must master. Over the years, modern browsers, frameworks, libraries, and tools have been developed, making it possible to identify, understand, and fix errors quickly and efficiently. In 2025, debugging has become an even more refined and multi-layered practice, with state-of-the-art tools, frameworks, and techniques that can handle the challenges of modern real-world projects. This blog post is about giving you the complete picture of how to debug with JavaScript in real-world projects in 2025. We will cover the basic debugging principles, effective debugging techniques and tools for different types of JavaScript projects, best practices for avoiding and fixing common bugs, as well as some expert advice and resources that can help you become a debugging master and an even more effective JavaScript developer. Whether you’re working on a single-page application, server-side Node.js scripts, or full-stack JavaScript projects, stay tuned for everything you need to know to debug your way to successful, high-quality, and error-free code.
- Understanding the Nature of Bugs in Modern JavaScript Projects
- Setting Up Your Development Environment for Maximum Debugging Efficiency
- Leveraging Modern Browser DevTools for Frontend Debugging
- Using Source Maps to Bridge Compiled and Original Code
- Debugging Asynchronous Code and Promises
- Incorporating AI-Powered Debugging Assistants and Tools
- Effective Logging Strategies and Monitoring
- Utilizing Unit, Integration, and End-to-End Testing for Pre-Debugging
- Mastering Debugging in Frameworks and Libraries
- Debugging Node.js Backends and Serverless Functions
- Using Remote Debugging and Collaboration Tools
- Post-Mortem Debugging and Incident Analysis
- Conclusion
- More Related Topics
Understanding the Nature of Bugs in Modern JavaScript Projects
JavaScript is no longer just simple snippets of code that run in the browser; it’s a powerful and complex language that powers modern client-side and server-side applications. JavaScript projects these days can range from complex single-page applications built with frameworks like React, Angular, or Vue.js, to full-stack applications using Node.js for server-side logic. Bugs can be introduced at many levels: from simple syntax errors to logical errors in code, from failures in asynchronous code handling or state management to problems in integration or communication with other systems, or even from issues in transpilation or bundling pipelines. Moreover, modern JavaScript projects can involve additional technologies, such as WebAssembly, microservices, and serverless computing, which add to the complexity of debugging. Understanding the nature and source of bugs in your project is a critical first step toward efficient and effective debugging.

Setting Up Your Development Environment for Maximum Debugging Efficiency
Setting up a proper development environment is one of the most important steps in the debugging process. In 2025, most JavaScript developers use integrated development environments (IDEs) or sophisticated code editors like Visual Studio Code or WebStorm, which provide debugging support and other advanced features out of the box. Make sure that your IDE/editor is configured correctly to run your code with debugging support, including correct source maps, linting rules, and any other plugins or extensions you might need for your project. You should also configure your build tools (Webpack, Vite, or Rollup, for example) to produce readable, well-formatted code artifacts with proper environment-specific logging and error handling, which will make it much easier to debug any issues that may arise.
Leveraging Modern Browser DevTools for Frontend Debugging
Browser developer tools have come a long way over the years and have become a real powerhouse for debugging modern web applications. The developer tools in modern browsers like Chrome, Firefox, and Edge can do much more than just inspect the DOM and log messages in the console. Browsers in 2025 have powerful features that can be used to debug JavaScript code, including intelligent breakpoints, async stack traces, live CSS and JavaScript editing, performance monitoring, and more, which can be used to debug JavaScript code directly in the browser. Mastering the use of these tools is essential for efficient and effective frontend debugging and can also greatly improve your overall understanding of the code you are working with.
Using Source Maps to Bridge Compiled and Original Code
JavaScript projects today often use transpilers (e.g., Babel), minifiers, or compilers (e.g., TypeScript), which means that the code that runs in the browser may look quite different from the code you are actually working with. Source maps are files that map the compiled code back to the original source code, which can be used by the debugger to step through the code and display errors in the original context. In 2025, source maps have become even more useful and are supported by virtually all modern build tools and frameworks. They can handle more complex scenarios such as multi-layer transpilation (e.g. TypeScript to ESNext to minified bundle), and using them is considered a best practice for effective JavaScript debugging.
Debugging Asynchronous Code and Promises
JavaScript is known for its asynchronous code, and debugging asynchronous code is one of the most common sources of bugs in JavaScript projects. Issues such as callback hell, unhandled promise rejections, race conditions, and other timing problems can be especially difficult to debug. In 2025, there are several techniques and tools available for effectively debugging asynchronous JavaScript code. The async/await syntax has made it much easier to write and read asynchronous code, but it has not made asynchronous programming bug-free. Debugging asynchronous code often involves using async stack traces, inspecting promises, and implementing robust error handling, which can catch and log errors systematically. In addition, some modern tools can help with testing asynchronous code, such as time-travel debugging and deterministic replay tools.
Incorporating AI-Powered Debugging Assistants and Tools
Artificial intelligence (AI) has made significant progress in recent years and has found its application in JavaScript debugging. AI-based tools and assistants can help to detect potential bugs in real-time, provide fixes, and even explain errors to developers, which can be especially helpful for less experienced developers. In 2025, these tools have become even more powerful and are integrated into the most popular IDEs and CI/CD tools. They can help to identify potential problems as you write code, making it easier to avoid bugs in the first place. In addition, AI-powered error pattern recognition and anomaly detection in logs and metrics can help identify recurring problems across large codebases and provide actionable insights that would be difficult to get through manual debugging.
Effective Logging Strategies and Monitoring
Logging is often the first line of defense in identifying and understanding problems in a production environment. In 2025, modern JavaScript projects often use structured logging techniques with JSON logs, correlation IDs for distributed tracing, and adjustable verbosity levels for different environments. When combined with modern monitoring platforms such as Sentry, Datadog, or New Relic, these logs can be used to trigger alerts, provide detailed stack traces, user session context, and even suggest root causes. Knowing how to instrument your code with effective and performant logging is an essential skill for any JavaScript developer.
Utilizing Unit, Integration, and End-to-End Testing for Pre-Debugging
One of the best ways to avoid having to debug is to catch bugs early, and automated testing is one of the most effective ways to do that. In 2025, modern JavaScript projects often use various testing frameworks and libraries, such as Jest, Mocha, Jasmine, or Cypress, to write unit tests, integration tests, and end-to-end tests. Unit tests can help catch bugs early by testing individual functions and components, while integration tests can help ensure that different parts of the system work together correctly. End-to-end tests can be used to simulate real user interactions with the application and can catch even more subtle bugs. In 2025, integrating testing suites into your CI/CD pipelines is considered a best practice, as it ensures that tests are run on every change, catching regressions early.
Mastering Debugging in Frameworks and Libraries
JavaScript frameworks and libraries have become an integral part of modern JavaScript projects, and each of them has its own quirks and patterns that affect debugging. In 2025, it’s important to know and understand the debugging tools and best practices specific to the frameworks and libraries you are using. For example, if you are working on a React project, you should be familiar with React Developer Tools, which provide a way to inspect the state and props of React components and diagnose common issues, such as unnecessary re-renders. Similarly, if you are working on an Angular project, you should be familiar with Augury, which provides a way to inspect the state and performance of Angular applications, and Zone.js, which is a core part of Angular’s async operations tracking. By mastering the debugging tools and best practices specific to the frameworks and libraries you are using, you can greatly improve your efficiency and effectiveness when debugging JavaScript code.
Debugging Node.js Backends and Serverless Functions
JavaScript debugging is not just about the browser; JavaScript backends and serverless functions have also become an essential part of many modern applications. Debugging server-side JavaScript code can have its own set of challenges, such as managing asynchronous event loops, handling memory leaks, and debugging external API integrations. In 2025, developers use the built-in Node.js debugger, remote debugging sessions, and performance profiling tools, in addition to standard logging and error reporting strategies. In addition, debugging serverless functions on AWS Lambda, Google Cloud Functions, and other platforms has become more effective thanks to local emulators and cloud-based observability solutions.
Using Remote Debugging and Collaboration Tools
Collaboration is becoming an increasingly important part of software development, and with more teams working remotely in 2025, remote debugging and collaboration tools are becoming more and more important. Thanks to the tools like Live Share in VS Code, remote browser sessions with synchronized devtools, and cloud-based IDEs, developers can debug together in real-time, greatly increasing the speed and effectiveness of the process. By using remote debugging and collaboration tools, you can reduce the context switching, facilitate pair programming, and accelerate the debugging process, especially when dealing with complex multi-component systems.
Post-Mortem Debugging and Incident Analysis
No matter how careful you are, things can still go wrong, and in 2025, debugging is not just about fixing things that are broken, but also about learning from your mistakes. Post-mortem debugging, which involves analyzing the reasons why something happened after the fact, is critical for preventing similar issues in the future. In 2025, post-mortem debugging involves many tools and techniques, such as analyzing core dumps, stack traces, user session replays, and anomaly reports generated by AI-based monitoring systems. Tools have become more automated in 2025, and can extract actionable intelligence from error snapshots and even recommend code fixes. A disciplined approach to post-mortem analysis, which involves detailed documentation, root cause analysis, and follow-up testing, can help to improve system reliability and developer expertise.
Conclusion
Debugging JavaScript code remains a critical and central part of software development, and in 2025, it continues to evolve alongside the language, frameworks, libraries, and tools that power modern JavaScript projects. By understanding the nature and source of bugs, setting up a proper development environment, mastering modern browser devtools, managing the challenges of asynchronous code and promises, and using modern AI assistants and tools, you can greatly improve your efficiency and effectiveness in debugging JavaScript code. In addition, by using effective logging and monitoring strategies, pre-debugging with unit, integration, and end-to-end testing, and using post-mortem analysis, you can prevent issues from occurring in the first place and improve the overall quality of your code. By embracing these best practices and techniques and staying up to date with the latest tools and frameworks, you can become a better JavaScript developer and build high-quality, reliable, and robust applications.
 Big O Notation Explained for Beginners
 AI in Gaming: Smarter NPCs and Environments
 Understanding Bias in AI Algorithms
 Introduction to Chatbots and Conversational AI
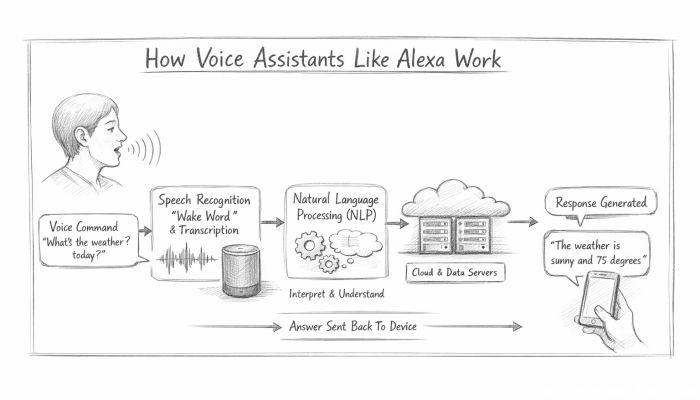 How Voice Assistants Like Alexa Work
 Federated Learning: AI Without Sharing Data