A Beginner's Guide to Data Visualization Tools
In today’s data-rich world, effective visualization is key to unlocking the stories hidden in our numbers. Charts, graphs, and interactive dashboards convert raw data into clear, understandable insights that lead to smarter decisions. For beginners, selecting the right tool is essential to create visualizations that communicate rather than confuse. This article overviews the most popular data visualization tools and guides you in choosing the best for your needs.
- What is Data Visualization
- Why Data Visualization is Important
- Features to Consider When Choosing a Visualization Tool
- Microsoft Excel
- Google Data Studio
- Tableau
- Power BI
- Canva
- Chart Types and When to Use Them
- Data Preparation and Cleaning
- Interactivity and Storytelling
- Learning and Community Resources
- Conclusion
- More Related Topics
What is Data Visualization
Data visualization is the process of presenting information in a graphical format. Charts, graphs, maps, and dashboards are used to turn data into easily understandable visuals. The goal is to represent data quickly and clearly, highlighting patterns, trends, and outliers. Visualization can tell stories and make information accessible to non-experts. For beginners, understanding the basics of charts, graphs, and choosing the right type of visualization is the key to unlocking data’s power.
Why Data Visualization is Important
Data visualization helps make sense of large and complex datasets. Charts and graphs reveal patterns and trends, simplifying communication and decision-making. Visualizations can quickly identify anomalies and correlations. Interactive dashboards help monitor data and key metrics over time. Visualization is crucial for reporting data in a way that stakeholders can understand and act on. It democratizes data, making it accessible and valuable for all.

Features to Consider When Choosing a Visualization Tool
The right visualization tool has features to meet your needs and goals. Begin by considering what you want to do with your data. Important features include ease of use, visualization types, data import, customization options, and interactivity. Tools should be intuitive, with simple and fast ways to build charts and dashboards. Ensure the tool supports the specific charts you plan to create. It should easily connect to data sources, such as spreadsheets or databases. Look for options to customize and format visualizations, as well as features to add interactivity to dashboards.
Microsoft Excel
Microsoft Excel is a popular spreadsheet program with basic data visualization capabilities. Excel can create bar charts, line graphs, pie charts, scatter plots, and more. It offers basic data analysis and mathematical functions. Excel’s strength is in data preparation and analysis, while its charting features allow users to visualize results. For beginners, Excel is familiar and easy to learn, making it a good starting point to explore data visualization basics.
Google Data Studio
Google Data Studio is a free data visualization tool that creates interactive dashboards. It can connect to Google Sheets, Google Analytics, SQL databases, and other sources. Google Data Studio is easy to use, with a drag-and-drop interface that doesn’t require coding knowledge. It offers a variety of charts and tables, as well as interactive filtering and elements like maps and scorecards. Google Data Studio is beginner-friendly and a great option for those who want a free tool to create basic interactive dashboards.
Tableau
Tableau is a data visualization platform that allows users to create interactive and shareable charts, graphs, and dashboards. It is a robust and professional tool with extensive visualization and data preparation options. Tableau can connect to many data sources, including Excel, SQL databases, and cloud data. It offers a user-friendly interface with drag-and-drop features. Tableau is beginner-friendly and has many online tutorials and resources for learning. It is ideal for those who want to advance beyond basic charting and create professional-grade visualizations.
Power BI
Microsoft Power BI is a business analytics tool that can transform and visualize data. Power BI features a drag-and-drop interface, a wide range of visualization options, and a range of pre-built data connectors. Power BI dashboards can be embedded in web pages and customized with options like formatting, tooltips, and drill-down capabilities. Power BI is beginner-friendly and ideal for those looking for a Microsoft ecosystem-native option for visualizing data.
Canva
Canva is a graphic design platform that includes simple data visualization options. Canva can be used to create charts, graphs, and infographics quickly and easily. It has a drag-and-drop interface, and a library of pre-made templates and design elements. Canva is beginner-friendly, and its options are best used for quick, visually appealing, non-technical charts.
Chart Types and When to Use Them
The different types of charts are used to visualize different types of data. Line charts are best for time series data, bar charts for categorical data, and pie charts for parts of a whole. Scatter plots are used for continuous data, while heat maps are for showing patterns in large datasets. The appropriate chart type depends on the message you want to convey and the data’s nature. For example, use a line chart to show trends and a bar chart for comparisons. Pie charts work well for showing proportions, and scatter plots for relationships. Experiment and find what works best for your data.
Data Preparation and Cleaning
No tool can fix messy data. Ensure that data is clean and well-formatted before creating visualizations. This may involve removing duplicates, correcting errors, or standardizing data. Also, consider removing irrelevant or unnecessary information. Well-prepared data will produce more accurate and meaningful visualizations. Spend time learning how to prepare and clean data in Excel or using the data preparation features in other tools.
Interactivity and Storytelling
Visualization is not just about creating charts; it is also about telling stories. Interactivity is an important part of modern data visualization. Interactive dashboards allow viewers to explore data, filtering or drilling down to find information. This helps viewers understand and engage with data on their own. Visualizations should also include context in the form of titles, labels, and annotations. Good storytelling helps convey the data’s message and ensures that viewers take the desired action.
Learning and Community Resources
Learning data visualization takes time and practice, and many resources are available online to help beginners. You can find online tutorials, forums, webinars, and blogs that can provide valuable information and guidance. Many tools, such as Tableau Public, Power BI Community, and Google Data Studio forums, also have user communities where you can explore examples, share your work, and get feedback. Engaging with the community is an excellent way to learn, improve your skills, and feel like part of a larger data visualization community.
Conclusion
Data visualization is the art and science of telling stories with data. Choosing the right tool is critical for making visualizations that communicate rather than confuse. This article has given an overview of the most popular data visualization tools, including Microsoft Excel, Google Data Studio, Tableau, and Power BI, among others. The tools discussed in this article have been categorized by difficulty level and key features. When choosing a tool, consider your experience level, goals, and budget. As you learn and grow your skills, remember that visualization is storytelling, interactivity, and good data preparation. Engage with the online community for resources and support. With the right tools, patience, and practice, data visualization can be a rewarding and impactful skill.
 Big O Notation Explained for Beginners
 AI in Gaming: Smarter NPCs and Environments
 Understanding Bias in AI Algorithms
 Introduction to Chatbots and Conversational AI
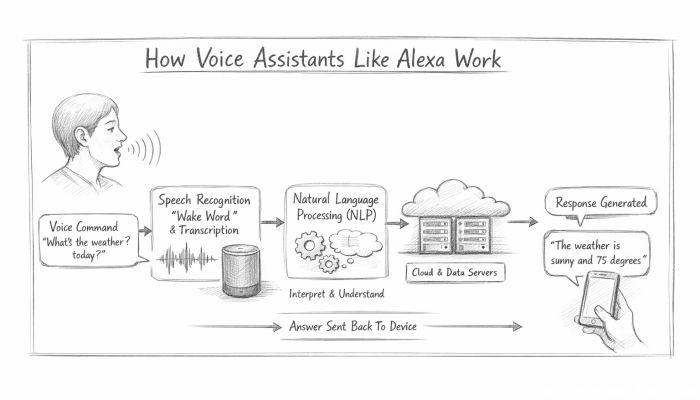 How Voice Assistants Like Alexa Work
 Federated Learning: AI Without Sharing Data