How to Use Machine Learning for Stock Analysis
The world of finance is complex and data-rich, and traditional methods of stock analysis often fall short in processing and interpreting large volumes of information. Machine learning (ML) has emerged as a game-changer, offering the ability to process massive datasets, identify patterns, and make data-driven predictions about stock performance. This comprehensive guide will delve into how to use machine learning for stock analysis, covering everything from selecting the right algorithms to preprocessing data and making predictions.
- Understanding Machine Learning in Finance
- Types of Machine Learning Algorithms for Stock Analysis
- Gathering and Preprocessing Data
- Feature Engineering in Stock Analysis
- Predicting Stock Prices with Supervised Learning
- Identifying Patterns with Unsupervised Learning
- Sentiment Analysis for Market Insights
- Reinforcement Learning in Algorithmic Trading
- Model Evaluation and Validation
- Risk Management with Machine Learning
- Tools and Platforms for ML Stock Analysis
- Combining Machine Learning with Traditional Analysis
- Conclusion
- More Related Topics
Understanding Machine Learning in Finance
Machine learning, a branch of artificial intelligence, enables computers to learn from data and make predictions without being explicitly programmed. In finance, ML algorithms analyze historical stock prices, trading volumes, market indicators, and even unstructured data like news or social media sentiment to identify patterns and generate forecasts. Unlike traditional statistical methods, ML can handle high-dimensional datasets, capture non-linear relationships, and adapt to dynamic market conditions. Understanding the potential of ML in finance is the first step towards unlocking its capabilities, allowing investors to shift from reactive decision-making to a more proactive, data-driven approach.

Types of Machine Learning Algorithms for Stock Analysis
Machine learning algorithms for stock analysis fall into several categories, each with its specific use cases:
- Supervised Learning: This involves regression and classification models that predict stock prices or categorize market trends based on labeled data.
- Unsupervised Learning: Algorithms that identify hidden structures in the data, such as clustering similar stocks or detecting anomalies in trading behavior.
- Reinforcement Learning: Focused on sequential decision-making and learning optimal policies, often used for developing algorithmic trading strategies.
- Deep Learning: Neural networks that can process large datasets, including unstructured data like news articles or earnings reports.
Choosing the right algorithm depends on the specific investment goals, data availability, and computational resources.
Gathering and Preprocessing Data
Data quality is critical for effective stock analysis using ML. Investors should gather historical price data, trading volumes, financial statements, economic indicators, and alternative datasets such as social media sentiment or news analytics. Preprocessing steps include cleaning missing values, normalizing scales, and encoding categorical data. Feature selection and dimensionality reduction techniques can help focus on the most predictive variables, while data transformation techniques can make models more robust and accurate. Proper data preparation is essential for ML models to learn accurate patterns and minimize the risk of overfitting or incorrect predictions.
Feature Engineering in Stock Analysis
Feature engineering involves creating meaningful variables from raw data to improve model performance. Common features include moving averages, volatility indices, relative strength indicators, and momentum scores. Technical indicators derived from price and volume data can help ML models capture market trends and patterns. Incorporating fundamental analysis features, such as earnings per share, debt ratios, or revenue growth, allows models to evaluate stock fundamentals in addition to technical signals. Careful feature engineering can enhance the predictive power of ML models and align them with both technical and fundamental investment strategies.
Predicting Stock Prices with Supervised Learning
Supervised learning models, such as linear regression, support vector machines, and random forests, are commonly used to predict stock prices. These models learn from historical input-output pairs to forecast future prices or returns. Investors can train models on historical datasets, validate them using test data, and evaluate their performance using metrics like mean squared error (MSE) or R-squared values. While supervised learning can provide actionable predictions, it’s important to remember that stock markets are influenced by stochastic events, and no model can guarantee perfect accuracy.
Identifying Patterns with Unsupervised Learning
Unsupervised learning algorithms, such as k-means clustering and principal component analysis (PCA), can help uncover hidden structures and patterns in financial data. Clustering can group stocks with similar price movements or sector performance, aiding portfolio diversification and risk management. PCA can reduce high-dimensional data into principal components that capture the majority of the variance, simplifying analysis. By identifying patterns and anomalies, unsupervised learning can provide valuable insights into market behavior and reveal opportunities that may not be apparent through conventional analysis.
Sentiment Analysis for Market Insights
Sentiment analysis involves using natural language processing (NLP) and ML to assess investor sentiment from news articles, social media posts, and earnings reports. Positive or negative sentiment can impact stock prices, and quantifying this effect can help traders anticipate market reactions. Techniques include text preprocessing, tokenization, and the use of algorithms such as recurrent neural networks (RNNs) or transformers. Integrating sentiment analysis into stock prediction models can provide a more holistic view, combining financial metrics with behavioral market factors.
Reinforcement Learning in Algorithmic Trading
Reinforcement learning (RL) applies ML to sequential decision-making problems, making it well-suited for algorithmic trading. In RL, agents learn optimal trading strategies by receiving rewards for profitable actions and penalties for losses. Over time, the model develops policies that maximize cumulative returns under different market conditions. RL is effective for dynamic trading environments, portfolio rebalancing, and automated execution strategies, allowing traders to adapt to evolving market patterns while minimizing manual intervention.
Model Evaluation and Validation
Evaluating ML models is crucial to ensure their reliability and prevent overfitting. Techniques such as splitting data into training and testing sets, using cross-validation, and assessing performance metrics like mean absolute error (MAE), root mean square error (RMSE), or classification accuracy for directional predictions can be used. Backtesting models on historical data can simulate real-world performance. Continuous monitoring and model retraining are essential since market conditions change over time, and static models may lose predictive power. Rigorous evaluation ensures that ML models provide actionable insights without over-reliance on historical patterns.
Risk Management with Machine Learning
While ML can enhance stock analysis, it is not a magic solution that can eliminate risk. Models may fail during unexpected market events, economic shocks, or high volatility periods. Integrating ML predictions with risk management strategies such as stop-loss orders, portfolio diversification, and position sizing can help mitigate exposure. Scenario analysis and stress testing can help investors understand potential losses under adverse conditions. Effective risk management ensures that ML-driven insights complement, rather than replace, prudent financial decision-making.
Tools and Platforms for ML Stock Analysis
Several platforms and libraries facilitate ML-based stock analysis:
- Python libraries such as scikit-learn, TensorFlow, and PyTorch support a wide range of ML models.
- Financial platforms such as QuantConnect, Alpaca, and Kaggle datasets provide historical market data and backtesting environments.
- Cloud computing platforms like AWS, Google Cloud, and Azure enable scalable processing for large datasets.
Choosing the right tools depends on data availability, computational needs, and the complexity of the models being developed. These tools streamline workflow and improve efficiency for individual traders and institutional analysts.
Combining Machine Learning with Traditional Analysis
For best results, ML should complement, rather than replace, traditional stock analysis methods. Fundamental analysis, which focuses on a company’s intrinsic value, and technical analysis, which studies price and volume trends, can both benefit from ML models that uncover complex patterns, process massive datasets, and make predictions that may not be apparent through manual analysis. Combining human judgment with ML-driven insights results in a holistic strategy that leverages the strengths of both approaches, improving decision-making and investment performance.
Conclusion
Machine learning is revolutionizing stock analysis, providing investors with powerful tools to process vast amounts of data, identify patterns, and make informed predictions. From supervised and unsupervised learning to sentiment analysis and reinforcement learning, ML offers versatile approaches for forecasting stock prices, assessing risk, and optimizing trading strategies. However, effective application requires careful data preprocessing, feature engineering, model evaluation, and integration with risk management practices. By combining ML-driven insights with traditional financial analysis and human expertise, investors can navigate complex markets more efficiently, make data-driven decisions, and potentially improve their returns. As technology continues to advance, machine learning will become an indispensable component of modern stock analysis, shaping the future of intelligent and adaptive investing.
 Big O Notation Explained for Beginners
 AI in Gaming: Smarter NPCs and Environments
 Understanding Bias in AI Algorithms
 Introduction to Chatbots and Conversational AI
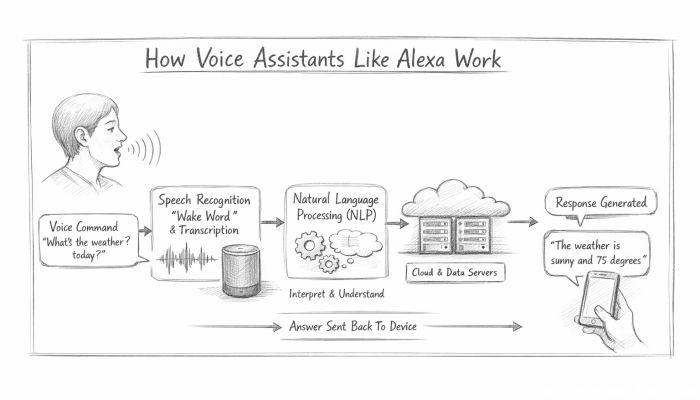 How Voice Assistants Like Alexa Work
 Federated Learning: AI Without Sharing Data