How to Create a Financial Dashboard for Business
Financial dashboards have become indispensable tools for decision-makers, offering real-time insights and powerful data visualization. From start-ups to large corporations, financial dashboards enable organizations to track performance, analyze trends, and make informed strategic decisions. This comprehensive guide will take you through 12 steps to building and optimizing your own financial dashboard, whether you’re new to this area or looking to refine your existing setup.
- Understanding What a Financial Dashboard Is
- Defining the Purpose of Your Dashboard
- Identifying Key Financial Metrics (KPIs)
- Choosing the Right Tools and Software
- Collecting and Integrating Financial Data
- Designing an Intuitive and Functional Layout
- Visualizing Data Effectively
- Ensuring Real-Time Data and Automation
- Customizing Dashboards for Different Users
- Incorporating Forecasting and Predictive Analytics
- Ensuring Data Security and Accessibility
- Measuring and Continuously Improving Dashboard Performance
- Conclusion
- More Related Topics
Understanding What a Financial Dashboard Is
Before diving into building a financial dashboard, it’s essential to understand its core purpose. At its heart, a financial dashboard is a visual representation of an organization’s financial data and key performance indicators (KPIs). Unlike standard financial statements, a dashboard compiles data from multiple sources and displays it in an easily digestible format.
The main goal of a financial dashboard is to offer real-time or near real-time access to financial metrics, trends, and overall performance. This allows users to quickly grasp the financial health of the organization and make informed decisions.
Visualizing data effectively is key to a dashboard’s success. It can include charts, graphs, gauges, and other visual elements that make complex financial data more understandable. For instance, a pie chart might be used to show the distribution of expenses, while a line graph could track revenue over time.
Financial dashboards can also provide alerts and notifications for specific financial events, such as budget overruns or cash flow shortages. This helps businesses to proactively manage their finances and avoid potential issues.
An important feature of modern dashboards is their interactivity. Users should be able to drill down into the data, filter results, and customize views to their needs. This enhances the user experience and ensures that the dashboard remains a useful tool for all stakeholders.

Another crucial aspect is the customization of a financial dashboard to suit the specific needs of a business. While some dashboards may be designed for a general overview, others might be tailored for specific departments like accounting, sales, or HR, each with its unique set of financial metrics.
Defining the Purpose of Your Dashboard
It is important to establish the purpose of your financial dashboard. The dashboard’s objective will inform what financial metrics it should track and how they are visualized. Start by asking the following questions:
- Who is the dashboard for?
- What business questions does it aim to answer?
- What key financial aspects does the business need to monitor?
- For example, is the dashboard designed for internal management or external stakeholders like investors? Is it meant to track overall profitability, manage budgets, or monitor cash flow?
If it’s for a startup, it might focus on tracking burn rate and runway. If it’s for a retail business, it might emphasize sales performance and inventory costs.
As you define the dashboard’s purpose, be specific and focused. This will ensure that your dashboard remains a relevant and efficient tool that aligns with your business goals and doesn’t get bogged down with unnecessary information that could confuse users.
Identifying Key Financial Metrics (KPIs)
The next step is to identify the Key Performance Indicators (KPIs) that your dashboard will track. These are the metrics that provide the most value and insight into the company’s financial health and progress towards its goals. Examples of key financial KPIs include:
- Revenue growth rate
- Gross and net profit margins
- Operating expenses
- Cash flow
- Accounts receivable/payable
- Budget variance
- Customer acquisition cost (CAC)
- Return on investment (ROI)
Businesses have unique KPIs depending on their industry and stage of development. For a growing tech company, user acquisition costs and monthly recurring revenue (MRR) may be top KPIs. For a mature manufacturing firm, inventory turnover and production costs might be more relevant.
The key is to be selective and not overwhelm the dashboard with too many metrics. Choose only those that truly impact decision-making and align with long-term business strategy.
Choosing the Right Tools and Software
There is no one-size-fits-all answer when it comes to dashboard software. The best dashboard platform should fit your specific needs, budget, and skill level. Some of the most popular dashboarding tools include:
- Microsoft Power BI
- Tableau
- Google Data Studio
- Zoho Analytics
- Klipfolio
If you’re a small business owner without a dedicated IT team, you might start with Excel or Google Sheets and add plugins or integrations as needed.
Keep in mind factors like ease of use, customization, scalability, integration capabilities, and support for real-time data updates when evaluating tools. The ideal dashboard software will be intuitive to use, visually appealing, and automate much of the data gathering and processing to reduce manual work.
Collecting and Integrating Financial Data
The quality of your dashboard is only as good as the data behind it. Data integration is the process of consolidating information from different sources to provide a unified view in the dashboard.
To build an effective financial dashboard, you will need to connect your accounting software, ERP, payroll tools, CRM, and bank feeds into a single dashboard platform.
This can usually be achieved using built-in connectors or APIs (application programming interfaces) provided by most dashboarding tools. Consider using automation features like Zapier if your existing tools don’t have direct integrations.
Data quality and accuracy is also important. Ensure the data feeding into your dashboard is clean, validated, and up-to-date. Establish regular synchronization and cleaning protocols so your dashboard is never presenting outdated or misleading information.
Designing an Intuitive and Functional Layout
Design matters. The layout of your dashboard impacts how quickly and accurately users can interpret the data it contains. An effective dashboard layout should prioritize the most important metrics and make it easy to identify trends, issues, and opportunities.
A good rule of thumb is to place the most critical KPIs in the top section of the dashboard for immediate visibility. Visualize trends and historical data in the middle section and use the bottom section for more detailed breakdowns or supporting information.
Keep visual design clean and minimal with sufficient white space. Use consistent colors, fonts, and charts for easy comprehension and a look that aligns with your brand.
Consider interactive elements like filters or drill-down links that allow users to customize views. Dashboards should avoid being cluttered or overwhelming. Opt for simple charts, clear labels, and logical flow.
Visualizing Data Effectively
The way data is presented visually in a dashboard plays a crucial role in helping users understand and derive insights. Select the right chart types for different data sets. Line charts are ideal for tracking trends over time, while bar charts are useful for comparing categories.
Pie charts work well to illustrate composition, and heat maps can highlight performance variations across regions or products. Use color coding consistently to indicate positive or negative performance.
Provide additional context where needed using tooltips or hover actions to display information without cluttering the screen. Test different visuals to see what conveys information most clearly and make adjustments for readability.
Ensuring Real-Time Data and Automation
Real-time monitoring is one of the key benefits of a modern financial dashboard. Automating data feeds so the dashboard updates automatically without requiring manual downloads saves significant time and reduces errors.
Configure live data connections from your financial and analytics tools to the dashboard. Automation also allows users to track changes to financial metrics, revenue, expenses, and cash position as they happen.
Alerts can also be set to notify users of threshold breaches in real time, like dropping profit margins or overdue receivables. Instead of having to manually check numbers, users can receive instant alerts and act quickly and proactively, rather than reactively.
Customizing Dashboards for Different Users
Remember that different stakeholders in your organization have different roles and responsibilities and thus need to see different information.
For example, a CEO needs an executive-level dashboard to make top-level decisions based on profitability, liquidity, and overall performance metrics. An accounting manager needs to track day-to-day accounts, budgets, and forecasts.
A marketing director may need to see how their campaign expenses and activities translate into new customer acquisition and ROI.
Create role-based dashboards that only display relevant information based on user needs and access levels. This reduces confusion and information overload, while also ensuring clarity and efficiency since each team member only sees the information supporting their own goals and responsibilities.
Incorporating Forecasting and Predictive Analytics
Forecasting and predictive analytics allow organizations to not just understand historical performance but to predict future scenarios. These can be built into a financial dashboard for faster, data-driven planning.
Dashboards can analyze past financial data and identify trends to forecast future revenues, expenses, and cash flow. Predictive models can also assess the likelihood of future risks such as revenue declines or cost overruns.
For example, dashboards can show projected future profits based on different sales volumes or marketing spend scenarios. As such, decisions are based on data-driven forecasts rather than assumptions.
Many dashboarding tools offer built-in forecasting using AI algorithms or statistical modeling. Integrating forecasting models turns your financial dashboard into a forward-looking planning tool as opposed to just a historical reporting tool.
Ensuring Data Security and Accessibility
Financial data is sensitive, so it is important to have access control and security on your dashboard. Ensure there are proper authentication methods and permission levels for users based on their roles.
The dashboard software should have data encryption and audit trails. Cloud-based dashboards should be compliant with global data security standards like GDPR or SOC 2. At the same time, it must be accessible to users on desktop and mobile devices.
Regular audits and backups can help to ensure ongoing security and data recovery in case of a breach. The right balance between data security and ease of access is important for dashboards to remain usable and trusted over the long term.
Measuring and Continuously Improving Dashboard Performance
Building a dashboard is not a one-time project but an ongoing process. Periodically evaluate its performance and usefulness by soliciting feedback from users and tracking how it is used.
Ask questions like: Are the current KPIs still relevant? Are users able to easily read and understand the visuals? Is the data updating as expected? Regularly assessing these areas helps to ensure the dashboard continues to add value.
Performance analytics can also be built directly into the dashboard to track engagement like how many users it has and what metrics they interact with most.
Continuous improvement and evolution will help your dashboard stay aligned with changing business needs and become a living system that improves over time.
Conclusion
In conclusion, a well-designed and thoughtfully constructed financial dashboard can be an organization’s most valuable business intelligence tool. It provides the visibility, analysis, and forecasting needed to effectively manage finances. By tracking key metrics in real-time, visualizing trends and KPIs in a dashboard, and automating data updates, you can truly transform your company’s financial management.
A financial dashboard empowers leaders to make faster and more informed decisions with the right information always at their fingertips. Over time it becomes indispensable in driving long-term profitability and success. So invest in building and maintaining a financial dashboard that fits your organization’s needs and evolves over time to remain relevant.
If you give it the thought and attention it deserves today, a dashboard will manage with you tomorrow.
 Big O Notation Explained for Beginners
 AI in Gaming: Smarter NPCs and Environments
 Understanding Bias in AI Algorithms
 Introduction to Chatbots and Conversational AI
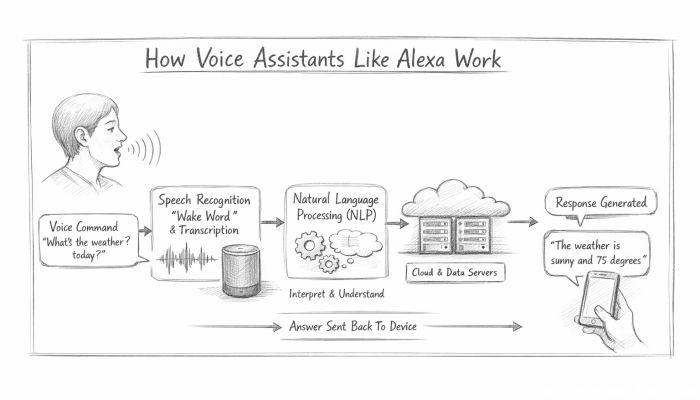 How Voice Assistants Like Alexa Work
 Federated Learning: AI Without Sharing Data