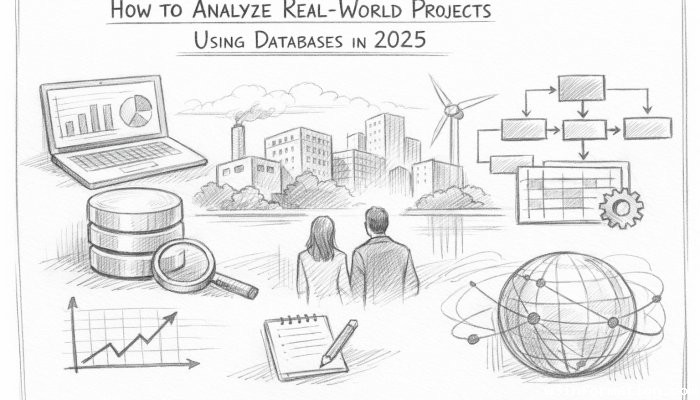
How to Analyze Real-World Projects Using Databases in 2025
Projects in the real world can be everything from building a house or office tower to developing a new software application, launching a marketing campaign, or conducting scientific research. They are complex, with multiple tasks, deadlines, resources, and objectives that need to be tracked and optimized. Databases are essential tools for analyzing and managing projects because they allow storing, organizing, and querying relevant data in a structured and consistent way. In this article, we will learn how to use databases to analyze real-world projects in detail. We will cover some of the most common types of databases, how to model and collect data for projects, how to ensure data quality and security, how to query and visualize data to extract insights and KPIs, and how to use advanced techniques like AI and machine learning to enhance our analysis.
- Understanding the Role of Databases in Project Analysis
- Types of Databases Best Suited for Project Data
- Data Modeling: Structuring Project Information
- Data Collection and Integration from Multiple Sources
- Ensuring Data Quality and Consistency
- Querying and Extracting Relevant Project Insights
- Utilizing Advanced Analytical Techniques on Project Databases
- Visualizing Data for Stakeholders
- Harnessing Cloud and Edge Databases for Real-Time Project Analysis
- Security and Privacy Considerations in Project Databases
- Automating Reporting and Alerts for Proactive Management
- Preparing for the Future: Trends in Database-Driven Project Analysis
- Conclusion
- More Related Topics
Understanding the Role of Databases in Project Analysis
A database for project analysis is a structured collection of data related to a specific project or a set of projects that we can use for various purposes. Databases make it possible to efficiently store, access, and manipulate data using a common format and syntax, such as SQL or NoSQL. Databases can be used to perform various types of queries on project data. We can filter, sort, group, aggregate, join, and update data as needed. We can also use databases to link data from different sources or tables, allowing us to create more comprehensive views of the project.
Types of Databases Best Suited for Project Data
There are different types of databases that we can use for project analysis, and each one has its own advantages and disadvantages depending on the nature of our data and our analytical needs. Here are some of the most common types of databases that we can use for project data.
### Relational Databases
Relational databases store data in tables with rows and columns, where each row represents a record and each column represents an attribute or field of the record. Relationships between records and tables are established through foreign keys and primary keys, which are unique identifiers for each row in a table. Popular relational databases for projects include PostgreSQL, MySQL, Oracle, SQL Server, and SQLite.
### NoSQL Databases
NoSQL databases store data in formats other than tables, such as documents, key-value pairs, graphs, or columns. They are often more flexible and scalable than relational databases and can handle unstructured or semi-structured data, complex relationships, or dynamic schemas. Popular NoSQL databases for projects include MongoDB, Cassandra, Redis, Neo4j, and DynamoDB.
### Hybrid Databases
Hybrid databases combine features of both relational and NoSQL databases. They can store data in multiple models or formats and support queries across different data types. Hybrid databases can offer the best of both worlds, depending on our project data and requirements. Popular hybrid databases for projects include Microsoft Azure, Google Cloud Spanner, Amazon Aurora, and ArangoDB.
### Specialized Databases
Specialized databases are designed for specific types of data or applications, such as time-series data, geospatial data, graph data, search data, or analytical data. They can offer better performance, features, or compatibility for certain types of project data or analysis tasks. Popular specialized databases for projects include InfluxDB, PostgreSQL with PostGIS extension, GraphDB, Elasticsearch, and BigQuery.
Data Modeling: Structuring Project Information
Data modeling is the process of defining how we store and represent data in a database. It involves creating a logical and physical schema of the data elements, their attributes, relationships, constraints, and rules that we want to capture and analyze. We can use various tools and languages to model our project data, such as ER diagrams, SQL scripts, UML diagrams, or JSON documents. The data model should reflect the reality and purpose of our project and its information needs.
Data Collection and Integration from Multiple Sources
To collect data for our project analysis, we need to identify the sources, methods, formats, and frequencies of the data we want to capture. We can use various tools and techniques to collect data from different sources, such as APIs, web scraping, sensors, surveys, documents, spreadsheets, databases, or external services. We can also integrate data from multiple sources into a single database or data warehouse for easier analysis and querying. Some tools that can help us with data collection and integration include:
- Python libraries like requests, pandas, numpy, scikit-learn, or BeautifulSoup.
- ETL (extract, transform, load) tools like Talend, Informatica, or Apache Nifi.
- Stream processing frameworks like Apache Kafka, Apache Flink, or Apache Storm.
- Data ingestion and integration platforms like Stitch, Hudi, Debezium, or dbt.
- Cloud-based storage and data services like Amazon S3, Azure Blob Storage, or Google Cloud Storage.
- Data connectors and APIs like Airbyte, Fivetran, Quicksight, or Looker.
Ensuring Data Quality and Consistency
Ensuring data quality and consistency is essential for any data-driven analysis. We need to verify that the data we collect and store in our database is accurate, complete, valid, relevant, and consistent. We can use various methods and tools to perform data quality checks and data cleaning, such as:
- Data profiling tools like Apache Atlas, Talend, or Informatica.
- Data validation rules and constraints in SQL or database schemas.
- Data cleansing and transformation tools like OpenRefine, Trifacta, or Alteryx.
- Data quality dashboards and reports like DataDog, DataLint, or Great Expectations.
- Data quality frameworks and libraries like pandas, numpy, scikit-learn, or TensorFlow.
Querying and Extracting Relevant Project Insights
Querying and extracting data from a database is the process of retrieving and manipulating data that we are interested in for our analysis. We can use various languages and tools to write queries and commands for our database, such as SQL, NoSQL queries, or database-specific APIs or SDKs. We can also use visualization and reporting tools to present and communicate the data insights we extract, such as:
- Visualization and reporting tools like Power BI, Tableau, or Looker.
- Data storytelling and communication tools like Jupyter Notebook, RMarkdown, or Sigma.
- Data exploration and analysis tools like pandas, numpy, scikit-learn, or TensorFlow.
- Data querying and manipulation tools like SQL, NoSQL, or database-specific queries.
- Natural language processing and generation tools like NLP, GPT-3, or BERT.
Utilizing Advanced Analytical Techniques on Project Databases
Utilizing advanced analytical techniques on project databases is the process of applying sophisticated methods and models to our data to gain deeper and more valuable insights. We can use various types of advanced analytics on our project data, such as:
- Predictive analytics: using statistical models, machine learning, or AI to forecast future events, trends, or outcomes based on our data.
- Prescriptive analytics: using optimization, simulation, or decision support systems to recommend the best course of action or solution based on our data.
- Descriptive analytics: using summarization, aggregation, or reporting to describe the current or past state of our data.
- Diagnostic analytics: using root cause analysis, anomaly detection, or correlation to identify the causes or factors of a problem or an event in our data.
- Exploratory analytics: using data discovery, experimentation, or hypothesis testing to explore new patterns, relationships, or opportunities in our data.
- Visual analytics: using data visualization, interactive dashboards, or graphics to enable visual perception and cognition of our data.
Visualizing Data for Stakeholders
Visualizing data for stakeholders is the process of creating and presenting data in a graphical or pictorial format that can be easily understood and communicated to different audiences. Visualization can help stakeholders see the big picture, identify trends and patterns, compare and contrast data, highlight key points, and support data-driven decision-making. We can use various types of visualizations for our project data, such as:
- Tables: using rows and columns to display structured and quantitative data in a tabular format.
- Charts: using lines, bars, pie slices, areas, or points to display trends, comparisons, distributions, or compositions of data.
- Maps: using geospatial data, symbols, colors, or shapes to display data on a geographic or spatial scale.
- Graphs: using nodes, edges, or arcs to display relationships, networks, or hierarchies of data.
- Infographics: using images, icons, text, or logos to display data in a creative or informative way.
- Dashboards: using multiple visualizations, indicators, or metrics to display data in a comprehensive or interactive way.
Harnessing Cloud and Edge Databases for Real-Time Project Analysis
Harnessing cloud and edge databases for real-time project analysis is the process of using remote or distributed databases that can store and process our data closer to the source or the end-user. Cloud and edge databases can offer many benefits for real-time project analysis, such as scalability, availability, reliability, performance, flexibility, cost-efficiency, or security. We can use various types of cloud and edge databases for our project data, such as:
- Cloud databases: using databases that are hosted and managed on remote servers or platforms that can be accessed over the internet.
- Edge databases: using databases that are deployed and run on local devices or servers that can process data near the source or the end-user.
- Hybrid databases: using databases that combine features of both cloud and edge databases and can operate across different environments or locations.
- Serverless databases: using databases that do not require server provisioning, management, or maintenance and can scale automatically based on demand.
- Blockchain databases: using databases that use distributed ledger technology to store and verify data in a secure, transparent, or immutable way.
- Server databases: using databases that run on physical or virtual servers that can provide dedicated or shared resources for data storage and processing.
Security and Privacy Considerations in Project Databases
Security and privacy considerations in project databases are the measures and practices that we need to follow to protect our data and ensure that it is not compromised, lost, or misused. Security and privacy are crucial for any data-driven project or analysis, as they can affect the confidentiality, integrity, availability, or compliance of our data. We can use various techniques and tools to secure and protect our project data, such as:
- Data encryption: using cryptography to convert data into an unreadable format that can only be deciphered with a key.
- Data masking: using techniques to hide or obscure sensitive or identifiable data elements with random or pseudo-random values.
- Data backup: using methods to copy or store data on a different location or device for recovery in case of loss or damage.
- Data backup: using methods to copy or store data on a different location or device for recovery in case of loss or damage.
- Data retention: using policies to define how long we keep our data and when we delete it based on our data lifecycle or legal requirements.
- Data governance: using frameworks or systems to manage and monitor how we use, share, store, or access our data based on our roles, responsibilities, or rules.
Automating Reporting and Alerts for Proactive Management
Automating reporting and alerts for proactive management is the process of using software or tools to generate and deliver data reports or notifications to ourselves or others without manual intervention. Reporting and alerts can help us monitor our project progress, performance, or status and take timely and appropriate actions based on the data. We can use various types of reporting and alerts for our project data, such as:
- Scheduled reports: using tools or scripts to create and send data reports on a regular basis, such as daily, weekly, monthly, or quarterly.
- Event-based alerts: using tools or scripts to trigger data notifications when a certain condition or threshold is met, such as a milestone completion, a budget overrun, or a risk occurrence.
- Exception reports: using tools or scripts to generate data reports that highlight or summarize unusual or significant data points, such as outliers, anomalies, or deviations.
- Key performance indicators (KPIs): using tools or scripts to track and measure our project performance or progress against predefined goals or standards.
Preparing for the Future: Trends in Database-Driven Project Analysis
Preparing for the future is the process of staying updated and informed about the latest trends and developments in the field of database-driven project analysis. The field of database-driven project analysis is constantly evolving and improving with new technologies, tools, techniques, and methods emerging or maturing every day. Here are some of the future trends in database-driven project analysis:
### Quantum Computing
Quantum computing is the use of quantum mechanical phenomena to perform data processing or computation. Quantum computing can potentially offer exponentially faster or more powerful data processing capabilities than classical computing and can be applied to various domains or tasks that involve complex, large-scale, or uncertain data.
### Augmented Analytics
Augmented analytics is the use of artificial intelligence, machine learning, or automation to enhance or augment the capabilities of data analysis or analytics. Augmented analytics can provide more intelligent, intuitive, or user-friendly data analysis or analytics and can be used to support various data-driven tasks or decisions.
### Edge AI
Edge AI is the use of artificial intelligence, machine learning, or automation to perform data processing or analysis closer to the source or the end-user of the data. Edge AI can offer lower latency, higher bandwidth, greater privacy, or reduced cost for data processing or analysis and can be used for various edge-based applications or scenarios.
### Semantic Databases
Semantic databases are databases that store and process data using a semantic or contextual representation, rather than a syntactic or structural one. Semantic databases can offer more natural, intuitive, or expressive data representation or understanding and can be used for various semantic-based applications or tasks.
### Decentralized Databases
Decentralized databases are databases that are not owned, controlled, or operated by a central authority or entity. Decentralized databases can offer more distributed, peer-to-peer, or collaborative data storage or access and can be used for various decentralized-based applications or scenarios.
### Blockchain-Based Databases
Blockchain-based databases are databases that use blockchain technology or distributed ledger technology to store or verify data. Blockchain-based databases can offer more secure, transparent, or immutable data storage or verification and can be used for various blockchain-based applications or scenarios.
Conclusion
In this article, we learned how to use databases to analyze real-world projects. We learned about some common types of databases, how to model, collect, and integrate project data, how to ensure data quality and security, how to query and extract relevant data insights, how to use advanced analytical techniques on project data, how to visualize data for stakeholders, how to use cloud and edge databases for real-time analysis, and how to prepare for the future with the latest trends and technologies in database-driven project analysis. Using databases for project analysis can help us store, organize, and query project data efficiently and effectively, and gain more valuable and actionable insights from the data.
 Big O Notation Explained for Beginners
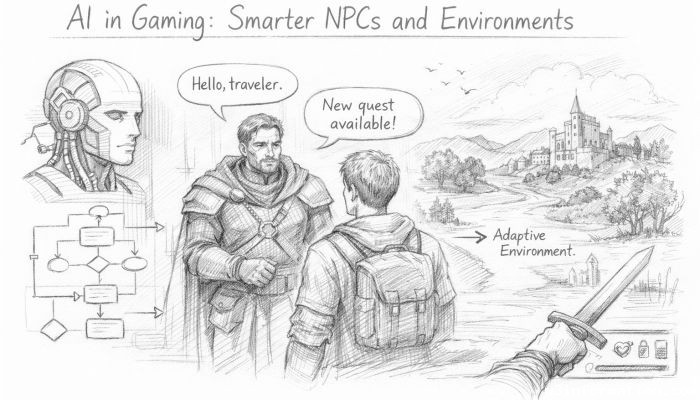 AI in Gaming: Smarter NPCs and Environments
 Understanding Bias in AI Algorithms
 Introduction to Chatbots and Conversational AI
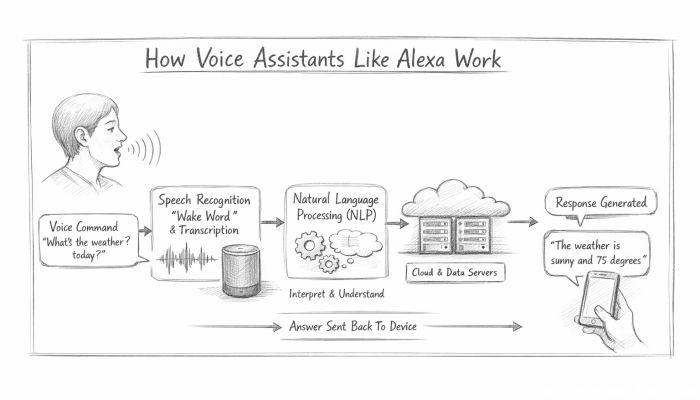 How Voice Assistants Like Alexa Work
 Federated Learning: AI Without Sharing Data